By Justin Behar, CEO and Co-founder, Quri

Retail execution is one of the most complex, labor-intensive operations in our consumer economy. Millions of items are touched multiple times on the way from the plant to the shelf every day across the U.S. and worldwide. And complex labor-intensive operations inherently carry error-rates that are only partially mitigated by work-flow systems. These remaining error rates continue to be a structural barrier to reaching “full execution.” Much like the immovable barrier to full employment (known as “structural unemployment”), retail execution carries a structural level of non-compliance due to human error.
You can’t fix what you can’t see
Brand managers, shopper marketers, sales managers and retail executives work in offices, but their products sit on tens of thousands of shelves spanning thousands of miles while in-store programs change monthly or weekly. Short of distributing webcams on every shelf, they can’t see how their products are being presented to shoppers at retail locations. Even if they could, they couldn’t efficiently measure and respond to non-compliant conditions of their products and programs across this vast array of shelves. At Quri, we call this the “Retail Blind Spot,” a problem created by the labor-intensive processes in retail execution.
Execution performance remains alarmingly high
As a retail intelligence and analytics company, Quri has conducted more than 1,300 execution compliance studies for fast-moving consumer good brands in grocery and mass channels. What we found over the 12-month period from July 2012 to June 2013 was that non-compliance in three key areas was much higher than conventional wisdom suggests.
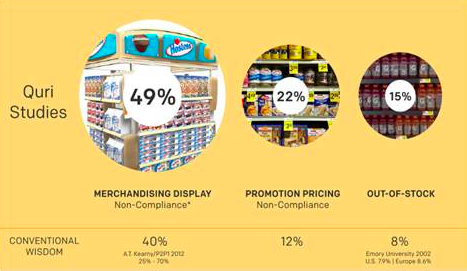
Given these results, we decided to study the behavior and impact of execution shortfalls during critical “Drive-Time” merchandising and promotional periods – the lifeblood of retail revenues because of their significant impact on sales.
The importance of Drive-Time events
“Drive-Times” are intensive promotion and merchandising events that drive major revenue peaks throughout the calendar year Drive-Time. The graphic below shows some of the most prevalent Drive-Time periods in grocery and mass channels over the calendar year.
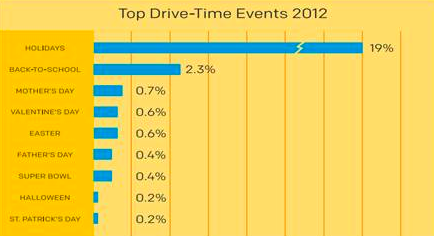
The total revenue generated during merchandising periods for grocery and mass channels is 25% of the total revenue generated in those channels. These events are critical periods of investment – from trade funds for promotional discounts, to national and local advertising, to merchandising displays, POS materials and in-store execution. Giving the importance of Drive-Time revenue and the need for efficient investing in the programs that drive these revenues, Quri looked closely at the impact that retail execution has on the revenue and ROI of Drive-Time periods.
Drive-Time model
Quri developed an in-depth Drive-Time economic model that maps key execution metrics into the revenue model of virtually any brand doing a two-week Drive-Time event. For any brand and any product we can input the following values to determine the sensitivity of execution performance on retail revenue:
· Specific brand’s product and associated promotional and everyday prices
· The number of stores in which the product was carried
· The shape of the underlying Drive-Time demand curve (e.g. index of likely consumer purchase behavior on each day of the event)
· The execution variables of stock availability and promotional pricing
We used this model to plot the Drive-Time revenue curves of more than a dozen different brands for a “standard two-week Drive-Time period,” such as Independence Day or back-to-school. With the ability to adjust the underlying demand curve, we were able to simulate any two-week promotional period of the year. By inputting different execution compliance rates (e.g. 10% out-of-stock or 20% promo pricing non-compliance) for a given product and promotional period we were able to plot two revenue curves:
· Actual Sales Curve – Daily revenue throughout the Drive-Time period reflecting the revenue loss caused by execution shortfalls.
· Full Execution Sales Curve – Daily revenue if execution compliance is 100%. In other words, the revenue you could get if your company executed flawlessly at retail.
The cost of imperfect execution – lost revenue
The following Drive-Time revenue curves represent the revenue performance over a two-week period for a center-of-store national food brand in grocery and mass channels. The actual revenue curve reflects execution compliance levels they have experienced over the past six months – 15% out-of-stock and 20% promotion pricing non-compliance (promo pricing not being set).
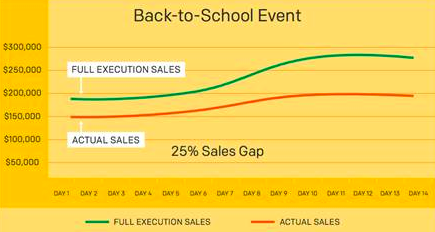
The Drive-Time model shows that the revenue gap between actual and full execution in this case is 25% – that is, the revenue would have been 25% higher were execution perfect. Of course, in a complex, labor-intensive activity like retail execution, “perfect” is a state no brand can achieve, but some can approach it in certain aspects of execution.
Closing the gap… in-market
This revenue gap image obviously begs the question “How can we close that space?” Brands regularly conduct post mortems after major promotional events to determine what they could have done to achieve greater sales and ROI. That’s a smart practice that definitely helps improve execution over time. But the question that we asked is “can the gap be closed during the Drive-Time event?” driving higher sales for the event happening now.
Here’s what we discovered:
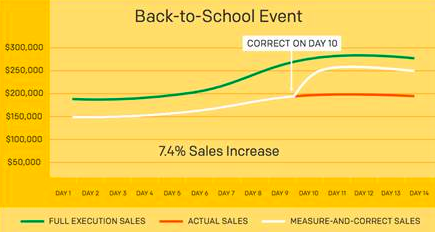
By measuring store-by-store execution gaps and then correcting those gaps before the Drive-Time event ends, brands can close the gap on the remaining days. The graph above shows the impact of measuring and correcting the gap on Day 10 of the two-week event. The benefit accrued from doing this is a 7.4% increase in revenue for the event overall.
And what if brands could measure and correct the execution gaps in five days?
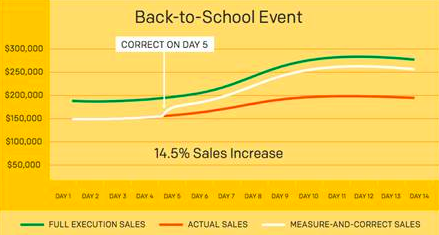
This five-day correction graph shows a much bigger portion of recaptured revenue, driving a 14.5% increase in sales. The conclusion one can draw from this is the faster you measure and the faster you correct, the more revenue you recapture.
How broadly do these results apply? From the modeling work we did, they apply across any brand, any product, any price and any channel.
Solving the retail blind spot
Though the results of the study seem disconcerting, there is hope: Technological innovations are allowing brands and retailers to corner around the retail blind spot. Advances in analytics and mobile crowdsourcing offer promising and effective means of closing persistent retail execution gaps. These solutions are just beginning to break through the execution fog in ways that seemed impossible before. The days of retail blind spots might finally become something that will be in the rearview mirror of all future Drive-Times for retailers and merchants everywhere.
Justin Behar is the founder and CEO of Quri, a retail intelligence and analytics company focused on solving the $600B opportunity in retail execution. At Quri, Justin advises global CPG brands (such as P&G, Nestle, Unilever and Tyson Foods) on how they can leverage technology and real-time data to optimize in-store execution. Justin regularly serves as an industry expert on the use of big data in retail, crowdsourcing and in-store execution. Prior to Quri, Justin was co-founder and managing director at Rutberg & Company, a research-driven advisory firm focused on mobile technology. Justin has deep roots in research technology, and was previously an analyst at Gartner and a director at iXL, a consulting and systems integration firm. Justin also advises and serves on the boards of a number of technology start-ups and non-profits.


